BioBlender visualization

BioBlender is a software package built on the open-source 3D modeling software Blender. BioBlender version 1.0 for Windows and Linux was released on July 12, 2013. The first beta version of BioBlender (v 0.1) was presented in September 2010.

BioBlender

BioBlender

BioBlender is the result of a collaboration, driven by the SciVis group at the Institute of Clinical Physiology (CNR) in Pisa, Italy, between scientists of different disciplines (biology, chemistry, physics, computer sciences) and artists, using Blender in a rigorous but at the same time creative way.

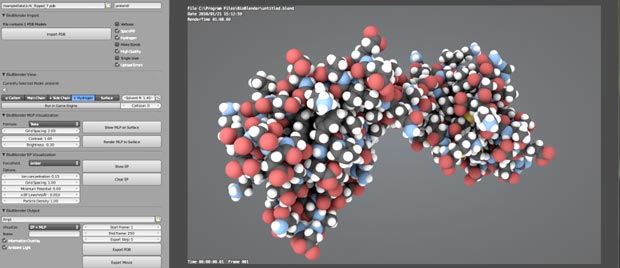
With BioBlender users can handle proteins in the 3D space, displaying their surface in a photorealistic way, and elaborate protein movements on the basis of known conformations. Scientists all over the world study proteins at atomic level and deposit information in the public repository Protein Data Bank, where each molecule is described as the list of its atoms and their 3D coordinates.

BioBlender can be used for:

  • import and visualize Protein Data Bank (PDB) files (The PDB file format is a textual file format describing the three dimensional structures of molecules held in the Protein Data Bank)
  • simulate molecular dynamics and optimize protein motion
  • visualize complex protein surface properties  (e.g. MLP and EP surface properties)

A BioBlender tutorial was published by Raluca Andrei, Mike Chen Pan and Monica Zoppè, in the BlenderArt magazine N.31 in December 2010.

Shiva & VisualEyes

Last update : July 24, 2013

SHIVA : Anatomy of a VisualEyes Project

SHIVA : Anatomy of a VisualEyes Project

VisualEyes is a flash-based authoring tool developed at the University of Virginia to weave images, maps, charts, video and data into highly interactive and compelling dynamic visualizations.

The project was started at the Virginia Center for Digital History with continued support from the University of Virginia’s Sciences, Humanities & Arts Network of Technological Initiatives (SHANTI). SHANTI promotes innovation at the University of Virginia through the use of advanced digital technologies in research, teaching, publishing and collaborative engagement.

The online VisualEyes edit-tool VisEdit is available at the VisualEyes website. The latest offering from SHANTI is SHIVA (Interactive Visualization Application), a first HTML5 tool  that makes it easy to create interactive visualizations. MapScholar is another HTML5 tool to create visual narratives using historical maps, media clips, and other visualization techniques.

After a beta trial, the full version of SHIVA Visualization was  released mid July 2013. The login page for registrated users is avaialble at the Shiva website.

Bill Ferster is the VisualEyes Project Director. At CTTE (Center for Technology and Teacher Education) he directs the PrimaryAccess Project, which enables middle and high school students to create digital documentaries using primary source documents online, and won in 2009 one of the American Association of School Librarians (AASL) 25 Best Educational Websites award.