Culturomics

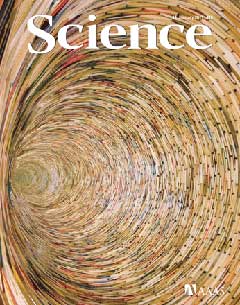
Cover of the Science Magazine January 14, 2011

Cover of the Science Magazine January 14, 2011

Culturomics is a form of computational lexicology that studies human behavior and cultural trends through the quantitative analysis of digitized texts. The term was coined in December 2010 in a Science article called Quantitative Analysis of Culture Using Millions of Digitized Books. The paper was published by a team spanning the Cultural Observatory at Harvard, Encyclopaedia Britannica, the American Heritage Dictionary and Google. At the same time was launched the world’s first real-time culturomic browser on Google Labs.

The Cultural Observatory at Harvard is working to enable the quantitative study of human culture across societies and across centuries. This is done in three ways:

  • Creation of massive datasets relevant to human culture
  • Use of these datasets to power new types of analysis
  • Development of tools that enable researchers and the general public to query the data

The Cultural Observatory is directed by Erez Lieberman Aiden and Jean-Baptiste Michel who helped create the Google Labs project Google N-gram Viewer. The Observatory is hosted at Harvard’s Laboratory-at-Large.
Logo of the Science Hall of Fame

Logo of the Science Hall of Fame

Links to additional informations about Culturomics and related topics are provided in the following list :

N-gram databases & N-gram viewers

Last update : May 13, 2013

An N-gram is a contiguous sequence of n items from a given sequence, collected from a text or speech corpus. An N-gram could be any combination of letters, phonemes, syllables, words or base pairs, according to the application.

An N-gram of size 1 is referred to as a unigram, size 2 is a bigram, size 3 is a trigram. Larger sizes are referred to by the value of N (four-gram, five-gram, …). N-gram models are widely used in statistical natural language processing. In speech recognition, phonemes and sequences of phonemes are modeled using a N-gram distribution.

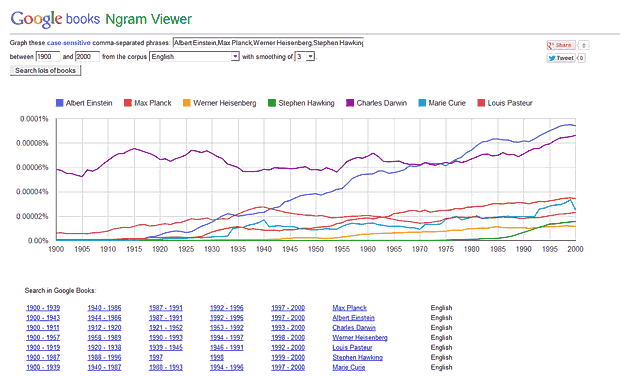
“All Our N-gram are Belong to You” was the title of a post published in August 2006 by Alex Franz and Thorsten Brants in the Google Research Blog. Google believed that the entire research community should benefit from access to their massive amounts of data collected by scanning books and by analysing the web. The data was distributed by the Linguistics Data Consortium (LDC) of the University of Pennsylvania. Four years later (December 2010), Google unveiled an online tool for analyzing the history of the data digitized as part of the Google Books project (N-Gram Viewer). The appeal of the N-gram Viewer was not only obvious to scholars (professional linguists, historians, and bibliophiles) in the digital humanities, linguistics, and lexicography, but also casual users got pleasure out of generating graphs showing how key words and phrases changed over the past few centuries.

Google Books N-gram Viewer, an addictive tool

Google Books N-gram Viewer, an addictive tool

The version 2 of the N-Gram Viewer was presented in October 2012 by engineering manager Jon Orwant. A detailed description how to use the N-Gram Viewer is available at the Google Books website. The maximum string that can be analyzed is five words long (Five gram). Mathematical operators allow you to add, subtract, multiply, and divide the counts of N-grams. Part-of-speech tags are available for advanced use, for example to distinguish between verbs or nouns of the same word. To make trends more apparent, data can be viewed as a moving average (0 = raw data without smoothing, 3 = default, 50 = maximum). The results are normalized by the number of books published in each year. The data can also be downloaded for further exploration.

N-Gram data is also provided by other institutions. Some sources are indicated hereafter :

Links to further informations about N-grams are provided in the following list :