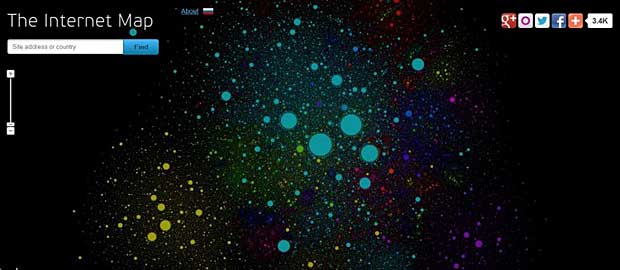
The Internet Map is an interactive, searchable, bubble-filled visualization of the Internet showing 350,000 websites, based on a traffic snapshot of the Internet from late 2011. It has been created by Ruslan Enikeev and went public on July 24, 2012.
The Internet Map shows each website as a circle, sized according to levels of web traffic. The circle’s colour indicates the country to which it relates. User’s switching between websites forms links, and the stronger the link, the closer the websites tend to arrange themselves to each other. Clusters on the map are semantically charged, they join websites together according to their content.

Internet Map by Ruslan Enikeev
The mathematical model is based on the thesis A Numerical Optimization Approach
to General Graph Drawing, submitted in 1999 by Daniel Tunkelang at the School of Computer Science, Carnegie Mellon University. The engineering solution is based on the Fast N-Body Simulation with CUDA, described by Lars Nyland and Mark Harris from NVIDIA Corporation and by Jan Prins from the University of North Carolina at Chapel Hill.
The technologies used to present the Internet map are Google maps engine for the visual display, Microsoft’s .net technologies for web query processing and Amazon AWS (S3, Cloudfront, Relational Database Services RDS and Elastic Beanstalk) for hosting and content delivery.
About 30 million picture tiles (256 x 256 pixels) are used to form the map. More than one million unique visitors saw the map during the first week after the project went online.
